
It was not all that long ago that a “map” of our moon, of Mars, of a large asteroid such as Vesta, of Titan, or of any hard-surfaced object in our solar system would have some very general outlines, some very large features identified, and then the extraterrestrial equivalent of the warning on Earth maps of yore that beyond a certain point “there be dragons.” Constructing a map of the topography and geology of a distant surface requires deep understanding and data and lot of hard work.
Yet such an in-depth mapping is underway and has already resulted in detailed surface rendering of Mars, of Jupiter’s moons Ganymede and Io, and of our moon. And now, using both Apollo-era data for the moon and measurements from the Japanese lunar orbiter and currently flying American orbiter, the U.S. Geological Survey, in partnership with NASA and the Lunar and Planetary Institute, has produced a rendering of our moon that moves extraterrestrial mapping significantly further.
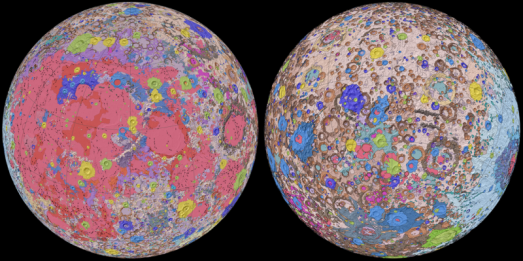
It unifies all the data collected using a variety of techniques and produces a map with well-defined geological units, with in-laid topography (on digital versions,) and with a guide of sorts for moon watchers on Earth. The red sections in the map above are the basalt lava flows that have the fewest craters from asteroid hits and so are the youngest surfaces. They are also the darker sections of the moon that we see when we look into the night sky at a full moon.
The maps are not at a detail to allow NASA mission planners to assess a landing site, but they do tell what the geological environs are going to be and so are a guide to what might be found.
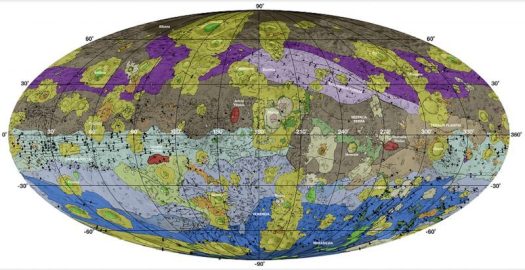
The chief purpose of the map — in which 5 kilometers of distance are represented by 1 millimeter on the map — is to summarize the current state of lunar geologic knowledge.
Like comprehensive geologic maps of the Earth, it provides a framework for developing new theory and for determining the regional significance of surface explorations. In addition, classifying units into type and age by photogeology allows scientists to better understand the possible origins for many features.
“This map is a culmination of a decades-long project,” said Corey Fortezzo, USGS geologist and lead author. “It provides vital information for new scientific studies by connecting the exploration of specific sites on the moon with the rest of the lunar surface.”
Elevation data for the moon’s equatorial region came from stereo observations collected by the Terrain Camera on the SELENE (Selenological and Engineering Explorer) mission that was led by JAXA, the Japan Aerospace Exploration Agency. Topography for the north and south poles was supplemented with NASA’s Lunar Orbiter Laser Altimeter data.
This significantly upgraded mapping of the moon comes at a time when NASA — at the behest of the Trump Administration — is actively planning a return to the moon with astronauts. There are many difficult challenges ahead, but the first landing with astronauts is tentatively scheduled for 2024.
“People have always been fascinated by the moon and when we might return,” said current USGS Director and former NASA astronaut Jim Reilly. “So, it’s wonderful to see USGS create a resource that can help NASA with their planning for future missions.”
This animation shows the moon in rotation with shaded topography from the Lunar Orbiter Laser Altimeter. The moon is slightly tipped to make the poles visible. In reality, the moon does not rotate but rather is tidally locked. (NASA/GSFC/USGS)
The USGS is, of course, best known for its detailed maps of the United States and the Earth. But since 1963 it has had an “astrogeology” mission as well, centered at what became the USGS Astrogeology Science Center in Flagstaff, Arizona. In that capacity, it works closely with NASA and sometimes with scientists at other institutions.
As explained by James Skinner, a research geologist for the USGS in Flagstaff, astrogeological maps describe what is visible now in a way that allows scientists to know a great deal about the history of the subject.
The maps break regions into units — a volume of rock or ice of identifiable origin and age range that is defined by the distinctive and dominant, easily mapped and recognizable features that characterize it. These include petrographic features (detailed analysis of the mineral content and the textural relationships within the rocks), lithologic features (the characteristics of rock formations), and paleontologic features (the geological history of the rock formation.)
“A lot of what we do involves determining contacts or boundaries between different units and determining what units are on top of or below others,” he said. “It’s hard to say exactly what a unit is, and that’s why so much time and effort goes in to making those maps.”
The purpose of these solar system maps is to give a broad but detailed picture of the surfaces for future study and exploration, and this lunar map goes into unusual detail with features. To the geologically initiated, the map includes crater rim crests, fissures (identifiable cracks), grabens (valleys), scarps (cliffs or steep slopes), mare wrinkle ridges (tectonic features in the low-lying lava fields), faults, troughs (a narrow basin or geologic rift), rilles (meandering channels that look like riverbeds but are formed by lava flows), and lineaments ( linear features in a landscape that are an expression of an underlying geological structure such as a fault.)
This particular new lunar map is “unified” because it took into account all the assessments by previous astrogeological map makers of the moon and produced one standard version that can now be used for lunar exploration.
The Astrogeology Science Center has made comparable (though less detailed because less data has been collected) maps of Mars, the moon Ganymede, and the asteroid Vesta, with similar mappings underway for Mercury and Jupiter’s moon Europa. Other NASA centers and academic groups have produced maps of Jupiter’s moon Io and Saturn’s moon Titan, as well as other bodies, generally in connection with specific research they are involved with.
Mapping the hard surfaces of our solar system is an enormous achievement, unimaginable not that long ago. Remember those canals on Mars that were avidly and erroneously identified and traced by men and women of science little more than a century ago?
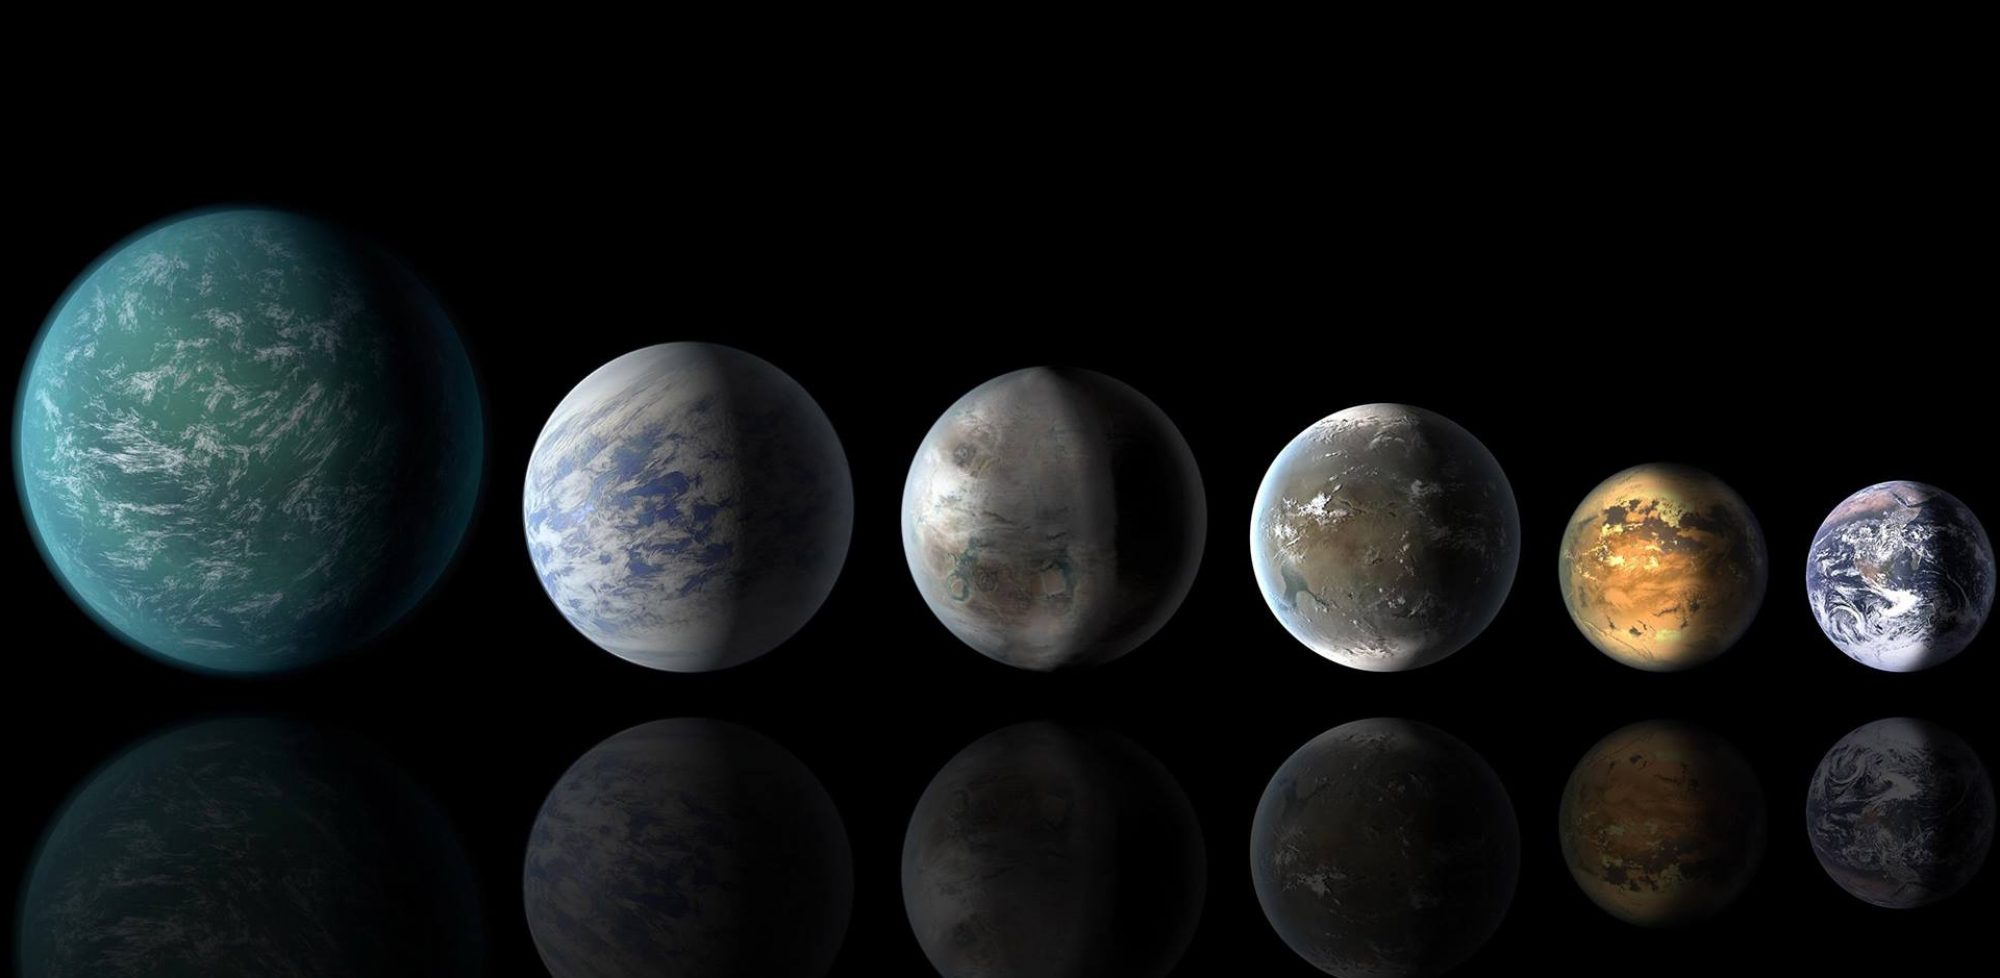
These maps make clear that we’ve come a very long way, but they also implicitly suggest just how little we know about planetary and lunar surfaces. While we can detect a fossil riverbed on Mars (a buildup of sediment that tells scientists that a river once ran there), we now know that there are billions and billions of planets beyond our solar system, and some of them clearly have hard surfaces. Will we some day map them, too?
That’s definitely for the far future since the planets are so much farther away than those in our solar system. But the technique needed to actually look at features of a very distant planet is known, though still in its infancy.
“Direct imaging” is a technique by which exoplanets are being discovered (and will in the future be characterized) through direct identification via powerful telescopes, rather than by measuring the indirect effects on their host stars. (A recent Many Worlds column looked at the possible detection via direct imaging of an exoplanet orbiting our nearest stellar neighbor, Proxima Centauri.)
While the number of planets identified via direct imaging remains small and most are gas giants, some of the results are remarkable. Below is a directly imaged movie of an exoplanet going behind the star Beta Pictoris and coming out again on the other side. The light from the host star is blocked so the exoplanet will not be lost in its blinding brightness.
The movie covers a period of four years and captures astronomical events occurring 63.4 light years away.

Many of the major telescopes of the future will feature variations on direct imaging, which is generally expected to become the gold standard for exoplanet discovery and characterizing in the decades ahead.
The Wide Field Infrared Survey Telescope (WFIRST), for instance, is being developed with a coronagraph to block out light from the host sun and to allow for exoplanet direct imaging — an architecture that would provide the first direct images and spectra of planets around our nearest neighbors similar to our own giant planets. WFIRST is a project very important to the exoplanet and astronomy communities, but not so much to the Trump Administration, which has sought to defund it twice.
The James Webb Space Telescope — now scheduled to launch in 2021 — has the capability through direct imaging to greatly increase the ability of scientists to characterize the atmospheres and temperature ranges of exoplanets. The JWST will not capture enough photons on its mirror to directly image the surfaces of planets, but future telescopes may well take us further in that direction.
While the JWST has a mirror diameter of more than 6 meters (21 feet), a space observatory that would have a mirror of either 8 meters (26 feet) or 15 meters (49 feet) in diameter is already well into the science and technology definition phase. Called the Large Ultraviolet-Optical-Infrared Surveyor (LUVOIR), it is in the running to be selected as NASA’s “great observatory” of the 2030s.
Then there’s the international ground-based Thirty Meter Telescope, ready for construction in Hawai’i with its 98-feet in diameter mirror. Work on the observatory has been halted because of protest from local residents who object to where it would be placed, but the TMT or other extremely large ground telescopes remain a near certainty.
If LUVOIR or the TMT become realities, then direct imaging of exoplanets will take a huge step forward. The resolution power will still not be enough and the star’s brightness will be too great to directly detect features on the surfaces of rocky exoplanets and map them. But the technological march to that day just might be underway.
